
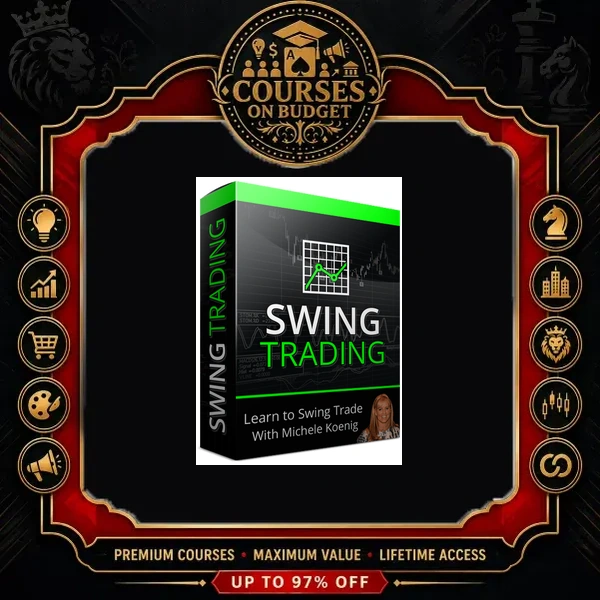
What Is the Investors Underground Swing Trading Course?
Most swing trading courses teach patterns in a vacuum. This one is recorded as a long conversation between Investors Underground’s host Cam and Michelle Koenig, a full-time trader since 2001 who runs the IU Swing Trade chat room under the handle “Offshore Hunter.” Every concept is tied to real daily and 60-minute charts, real entries, real stops — and, rare for this niche, real losing trades.
Her definition sets the tone for everything that follows: a swing trade is held “just overnight to several days, up to several weeks or even a month or two,” and the goal is the meat of the move, not the exact top or bottom. If you are building a library of stock and forex trading courses, this is the compact, process-first program that sits between beginner theory and advanced momentum day trading.
Meet the Trader: Experience You Can Verify on the Chart
Chapter 1 is an honest origin story, and it is the reason this course earns trust. Michelle holds a business finance degree from Montana State University and worked in pharmaceutical sales, as an office manager at Edward Jones and in software sales before trading part-time. She started with an account of “less than $10,000,” read John Murphy’s Technical Analysis of the Financial Markets “cover to cover multiple times,” and went full-time in 2001.
She tells you what most educators hide: her account more than doubled within three months of going full-time — and then fell back under $10,000 a few months later through overconfidence, averaging down and trading without stops. She joined Investors Underground in 2009, became a Momentum Room moderator in 2010 and has run the Swing Trade room since January 2014. That combination of a blown-up account and 14 years of full-time survival is exactly why her rules are so strict.
What You Will Learn Inside
1. Her One Setup: the 60-Minute 50 EMA “Trend Change”
Asked which single setup she would keep if she could trade only one, the answer is direct: “it would be off the 60 minute chart using the 50 period exponential moving average.” A “trend change” is price moving from below to above that 50 EMA. The workflow is a clean three-step routine: find the pattern on the daily chart and draw the lines, drop to the 60-minute chart to time the entry, then confirm with indicators.
2. Breaks “by Price, Not by Time”
A trendline break only counts when it is made by “a nice white candle with volume” — not by price drifting sideways through the line. This one filter alone removes a huge share of the fake breakouts that frustrate part-time traders.
3. The Right Indicator for the Right Market
Chapter 3 explains not only how indicators work but when they stop working. Stochastics and RSI are leading oscillators that shine in trading ranges but “stay overbought/oversold” in strong trends; MACD and moving averages lag and work in trends but give false signals in chop. Her daily chart: 200-day SMA, 50-day EMA, volume, MACD (12/26/9) and RSI(14). Her 60-minute chart: 50 EMA, volume, slow stochastics (80/20) and hand-drawn trendlines.
4. Long and Short Setups With Measured-Move Targets
Chapters 4 and 5 cover the patterns she actually trades, each with its target logic. She calls the bull flag “the most reliable of all the patterns that I play” — and warns: “If you’re having to look too hard to identify a specific pattern… it’s probably not there.”
| Pattern | Bias | Target logic taught |
|---|---|---|
| Bull flag / bull pennant | Long | Pole length added to the breakout |
| Ascending & symmetrical triangle | Long (symmetrical: wait for confirmation) | Widest part of the triangle |
| Cup and handle | Long | Depth of the cup; handle ideally retraces ≤ 1/3 |
| Inverse head and shoulders | Long | Head-to-neckline distance |
| Falling wedge | Long | No measured target |
| Bear flag / descending triangle | Short | Pole length / widest part subtracted |
| Head and shoulders top | Short | Head-to-neckline distance |
| Rising wedge | Short | No measured target |
Targets are taught as guides with no promised timeframe. Chapter 7 adds her personal favorites: bottom plays, rounding bottoms, gap-resistance tests after big gap-downs, bounces off the 200-day moving average and the “second entry” on a retest of the breakout level.
5. Trading Ranges: “Wash, Rinse, Repeat”
Chapter 6 turns support and resistance into a playbook. A trendline needs at least two points of reference, broken support becomes resistance, and horizontal ranges or rising/falling channels — her “friendly stocks” — are traded by buying support and selling resistance, timed with slow-stochastic extremes. When the range breaks, you trade the new trend.
6. Stops, Exits and Overnight Risk
Hard stops set immediately after entry at a technical level, raised as the trade works. Smaller size so you can afford a wider stop. Exits at daily support/resistance, on a break of the trendline or the 60-minute 50 EMA, at overbought readings or when the sector turns. Never average down. Keep day trades and swing trades separate so a losing day trade never becomes an accidental swing. Her summary: “I’m never going to go broke taking profits. I can always, always reenter a trade once the stock sets up again.”
Real Trades Broken Down — Winners and Losers
Chapter 7 is the heart of the course: 1 hour 21 minutes of her actual StockCharts and thinkorswim workflow. You see the LOCO long (stopped out, re-entered, stop raised), a CLVS swing closed at $68 and an NFLX short taken from $378 and covered near $344 — next to the trades that failed, like a WUBA bear-flag short stopped out at $40.10 and an ISIS short entered before full overbought confirmation. Seeing why a valid setup still loses is worth more than any highlight reel.
Her scanning “secret” is refreshingly unglamorous: “That is the secret to my scanning: just time and lots of charts.” She reviews roughly 100 charts on a slow day and 200–300 on a busy one using StockCharts watchlists (a daily “ABC” list, sector lists and a 60-minute list) plus Finviz gainers and losers in chart view.
Course Curriculum — Full Video Index
Eight chapters, recorded in a structured interview format and delivered as MP4 files (1.27 GB in total):
- 🎬 Chapter 1 — Introduction (34m 57s): her path from part-time to full-time, the blown-up account and the IU swing room
- 🎬 Chapter 2 — Getting Started (33m 01s): holding periods, overnight gap risk, ETFs vs leveraged ETFs, separating day and swing accounts
- 🎬 Chapter 3 — Intro to Technical Analysis (1h 05m 56s): candlesticks, moving averages, MACD, RSI, stochastics, divergences, volume
- 🎬 Chapter 4 — Long Setups (48m 55s): flags, pennants, triangles, falling wedge, cup and handle, inverse H&S
- 🎬 Chapter 5 — Short Setups (22m 02s): bear flag, descending triangle, rising wedge, head and shoulders top
- 🎬 Chapter 6 — Trading Range, Support & Resistance (39m 45s): trendlines, role reversal, channels and range trading
- 🎬 Chapter 7 — Trading Strategy (1h 20m 57s): scanning, chart setup, the 60-minute 50 EMA entry, live trade breakdowns
- 🎬 Chapter 8 — Questions and Answers (1h 00m 36s): market internals, losing streaks, position size, going full-time
Who Is This Swing Trading Course For?
- Part-time traders with a day job — Chapter 2 presents swing trading as “a good option” when you cannot watch the screen all day.
- Day traders adding a swing book — Chapter 8 explains how to step up from 1-minute charts to 15-minute, 60-minute and daily charts.
- Traders who keep losing money — the Q&A covers timeouts, cutting size (e.g. from 100 shares to 25–50), boredom trades and “emotional capital.”
- Alert followers who want independence — she refuses to post entries and exits, calling blind copying “a recipe for having your account blown up.”
- One concrete, repeatable entry model (daily pattern + 60-minute 50 EMA)
- Every pattern taught with its measured-move logic
- Losing trades and a blown-up account discussed openly
- Clear rules on when each indicator fails
- Short, focused runtime you can finish in a weekend
- Chart examples date from 2014–early 2015
- No fixed position-sizing formula is given
- Platform references (thinkorswim/Ameritrade) are dated
- US equities only — no forex or futures
Frequently Asked Questions
How long are trades held in this swing trading method?
Which indicators does the course use?
Do I need Level 2 or paid scanners?
How do I receive the course?
Is this financial advice?
Investors Underground Swing Trading is the course you take when you want a process, not a signal service. In 6.5 hours you get one high-conviction entry model, a pattern library with target logic, a range-trading playbook and an unusually honest look at what goes wrong — from a trader who has survived full-time since 2001. As she puts it: “Hope is not a strategy.” Rules are.
Pair it with the momentum side of the same school or other cheap trading courses, check what’s new on the updates page, and get the full program through Courses On Budget.
Browse the category: Trading Courses
Official school: investorsunderground.com
More from Investors Underground & related swing courses:


Reviews
There are no reviews yet.