What is a Wyckoff Point And Figure Charts for Cheap?
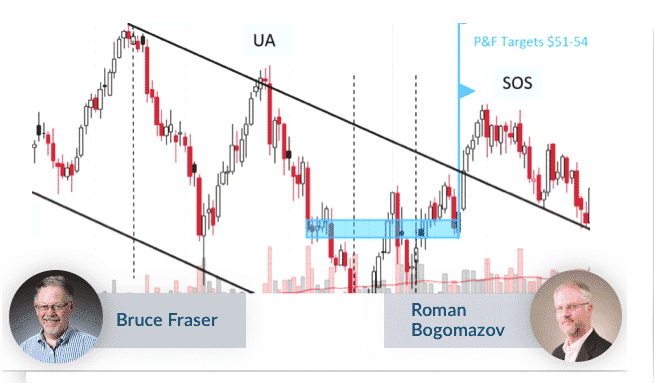
Starting with Wyckoff’s fundamental law of Cause and Effect, where the P&F count within a trading range represents the Cause and the subsequent price movement the Effect, Bruce and Roman cover:
- How to properly construct a Wyckoff-style Point-and-Figure chart
- Basic Wyckoff P&F count guidelines and modern applications
- P&F Phase Analysis to predict shorter- and longer-term price objectives for both long and short trades
- Using P&F counts in conjunction with bar charts to help time trade entries
Wyckoff Point And Figure Charts Index:
📄 Thumbs.db (11.50 KB)
📄 Wyckoff Analytics Point and Figure Charts Course, Part 1 (5-4-15).mp4 (182.04 MB)
📄 Wyckoff Analytics Point and Figure Charts Course, Part 2 (5-11-15).mp4 (228.08 MB)
📄 Wyckoff Analytics Point and Figure Charts Course, Part 3 (5-18-15).mp4 (207.46 MB)
📄 Wyckoff Analytics Point and Figure Course, Part 1.pdf (3.88 MB)
📄 Wyckoff Analytics Point and Figure Course, Part 2.pdf (4.22 MB)
📄 Wyckoff Analytics Point and Figure Course, Part 3.pdf (2.18 MB)
💬 Feel free to REACH OUT to our CHAT support for personalized assistance and detailed information tailored to your needs. We’re here to help!


Reviews
There are no reviews yet.